Intelligence Dashboard
Designing a unified system to track, analyze, and optimize plant logistics operations in real time.
Role
UX/UI Design
Platform
Logistics
Duration
3 months
Tool
Figma

Overview
Designed a logistics intelligence dashboard that connects plant operations, delivery performance, and compliance into a single decision-making system—helping teams identify bottlenecks and improve turnaround time.
Problem Statement
Stakeholders had to rely on manual reports and multiple tools to monitor dispatch efficiency, compliance, and delivery performance. This process was time-consuming, often confusing, and led to delays in taking action because there was no single place to see all the important data clearly.
Challenges
We have Identified 3 macro challenges:
Data Integration from Multiple Sources: Bringing together data from different systems (transporters, billing, tracking, safety) was complex, as each had its own format, update cycle, and reliability issues.
Designing for Different User Roles: The dashboard had to serve plant heads, logistics managers, and compliance officers—each needing different KPIs—without cluttering the interface or overwhelming users.
Real-Time Accuracy and Performance: Ensuring that the data shown was always up-to-date and loaded quickly was a challenge, especially when tracking live vehicle movements or calculating time-sensitive metrics like TAT or SLA breaches.
Impact
The introduction of the intelligence dashboard has transformed the way logistics operations are managed, delivering real-time insights and enhanced coordination across all stages of the supply chain. By leveraging advanced data analytics and seamless integration with partner systems, the dashboard empowers teams to respond swiftly to incidents, maintain high tracking accuracy, and improve collaboration with multiple logistics partners.


Goals
Centralize all transport data into a single, unified dashboard
Provide real-time insights to support faster, data-driven decisions.
Track and compare vendor performance to improve accountability and efficiency.
Solution & Process
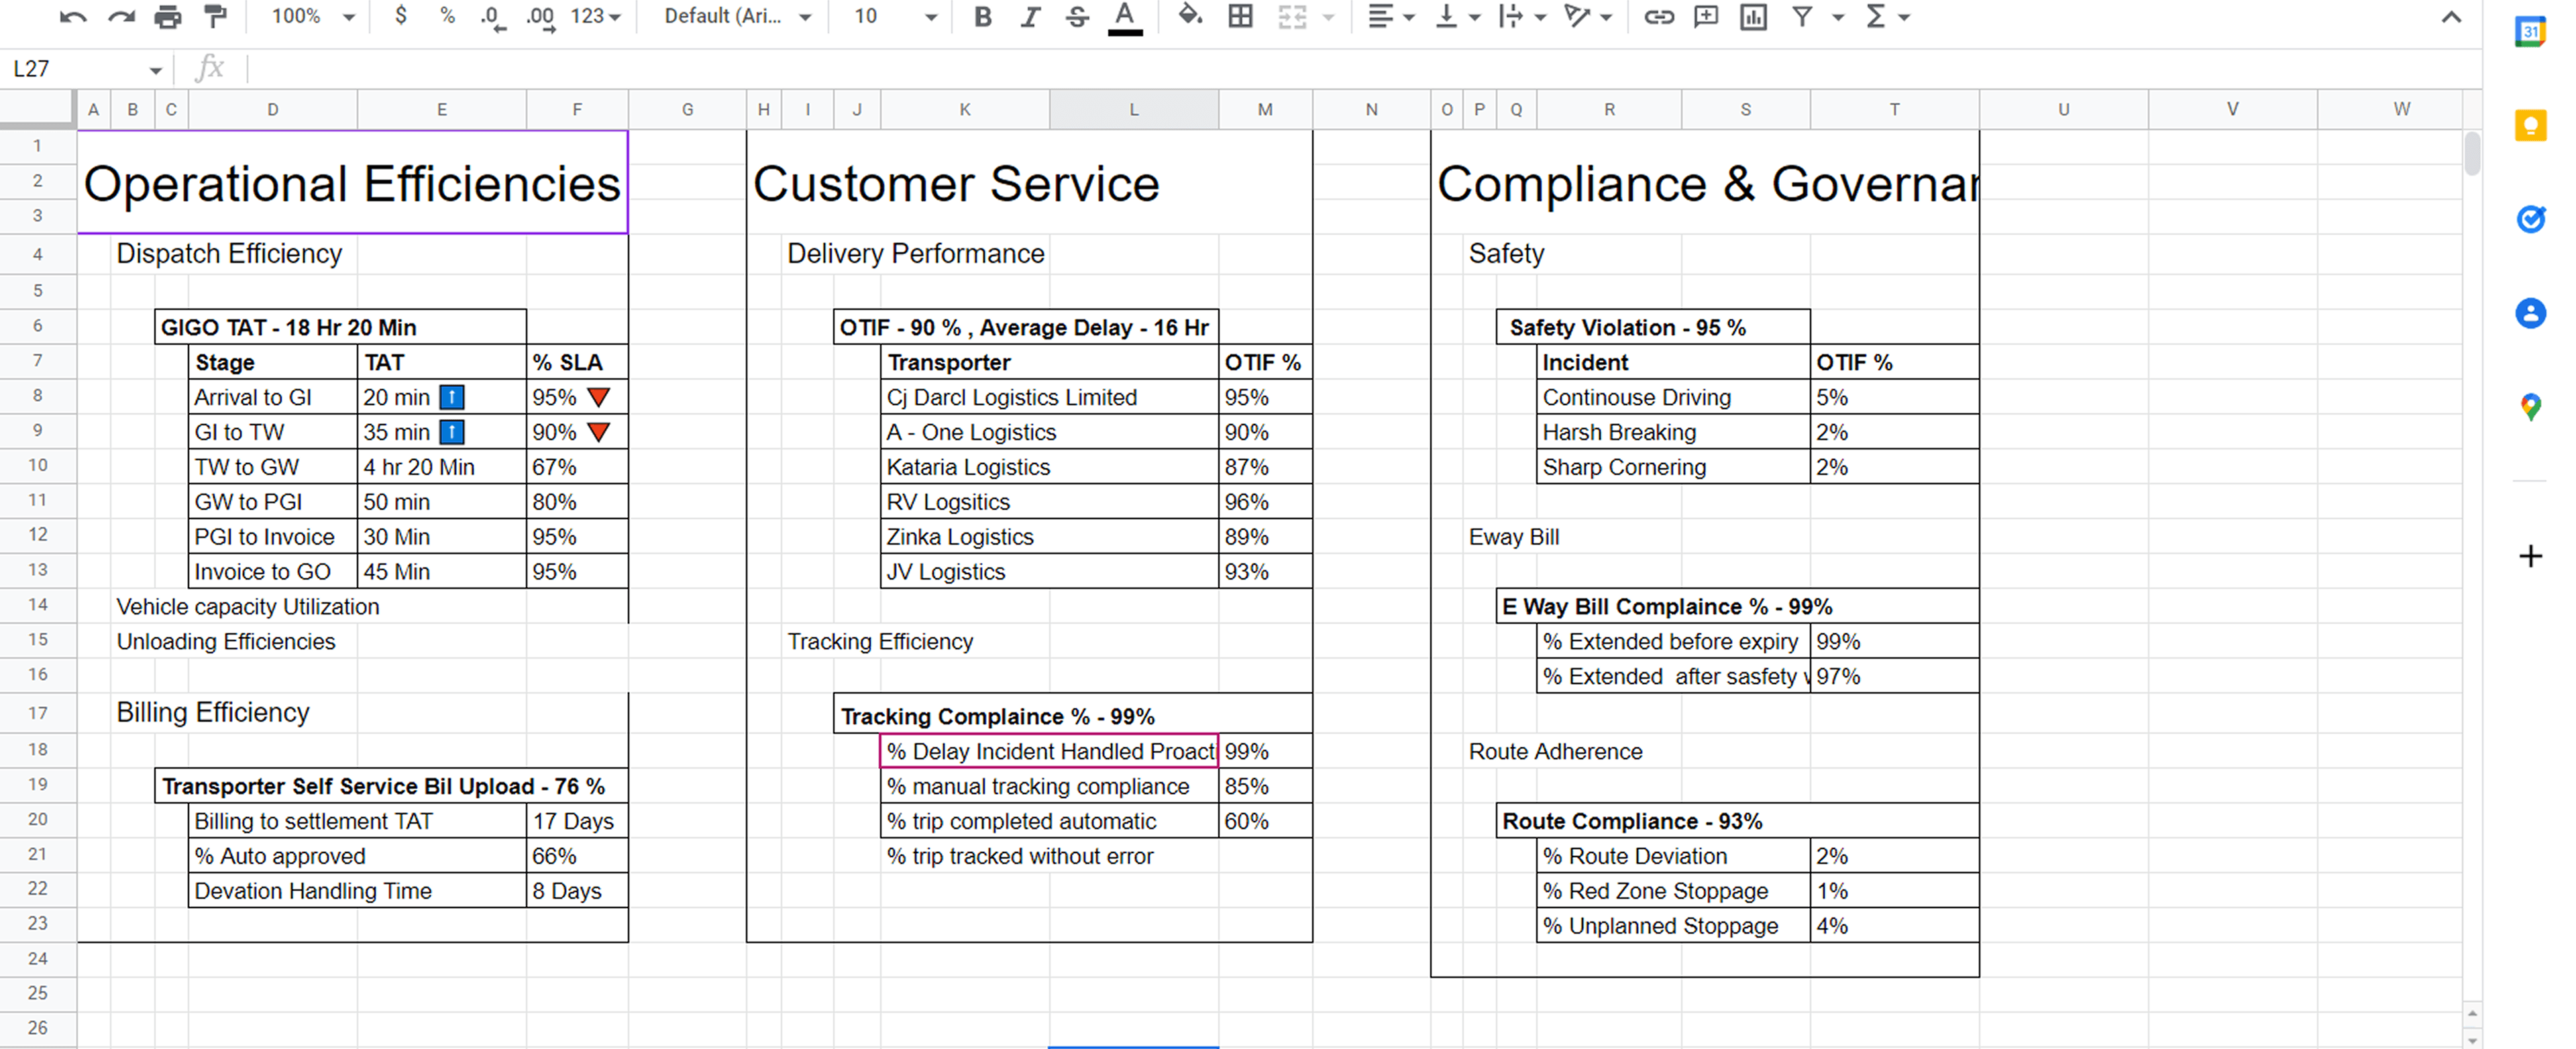
I designed a central dashboard that displays real-time data trends, vendor-wise OTIF performance, tracking compliance, safety metrics, and e-way bill adherence. The dashboard simplifies decision-making and speeds up exception handling.
Now the process is simple and straightforward .
Step-1 - Understanding the problem and challenges
We began by closely analyzing the current process and speaking with stakeholders to understand the day-to-day challenges they faced—such as delays in dispatch updates, poor visibility into vendor performance, and difficulty tracking KPIs in real time.
Step-2 - Collecting Pain Points
Next, we gathered pain points from different users, including plant heads, yard managers, and logistics teams. These included issues like data being spread across multiple tools, manual Excel tracking, lack of real-time alerts, and no unified view of operations.
Step-3 - Implementing Those Points into Design
Using these insights, we designed a dashboard that directly addresses the users’ needs. We focused on creating a layout that is easy to understand, highlights the most critical metrics, and brings together all transport-related data into one clean and interactive interface
Step-4 - Iterations and Hi-Fi Design
We refined the design over several rounds, based on internal reviews and early user feedback. Each iteration helped us improve usability, visual clarity, and flow. The final high-fidelity design was polished, responsive, and tailored for fast decision-making.

Step-5 - Customer Feedback and Final Integration
After sharing the design with actual users, we collected feedback on what worked and what needed improvement. We made final updates accordingly and successfully integrated the dashboard into client's existing systems, ensuring smooth adoption and daily use.

Other projects
TMS Platform 2.0
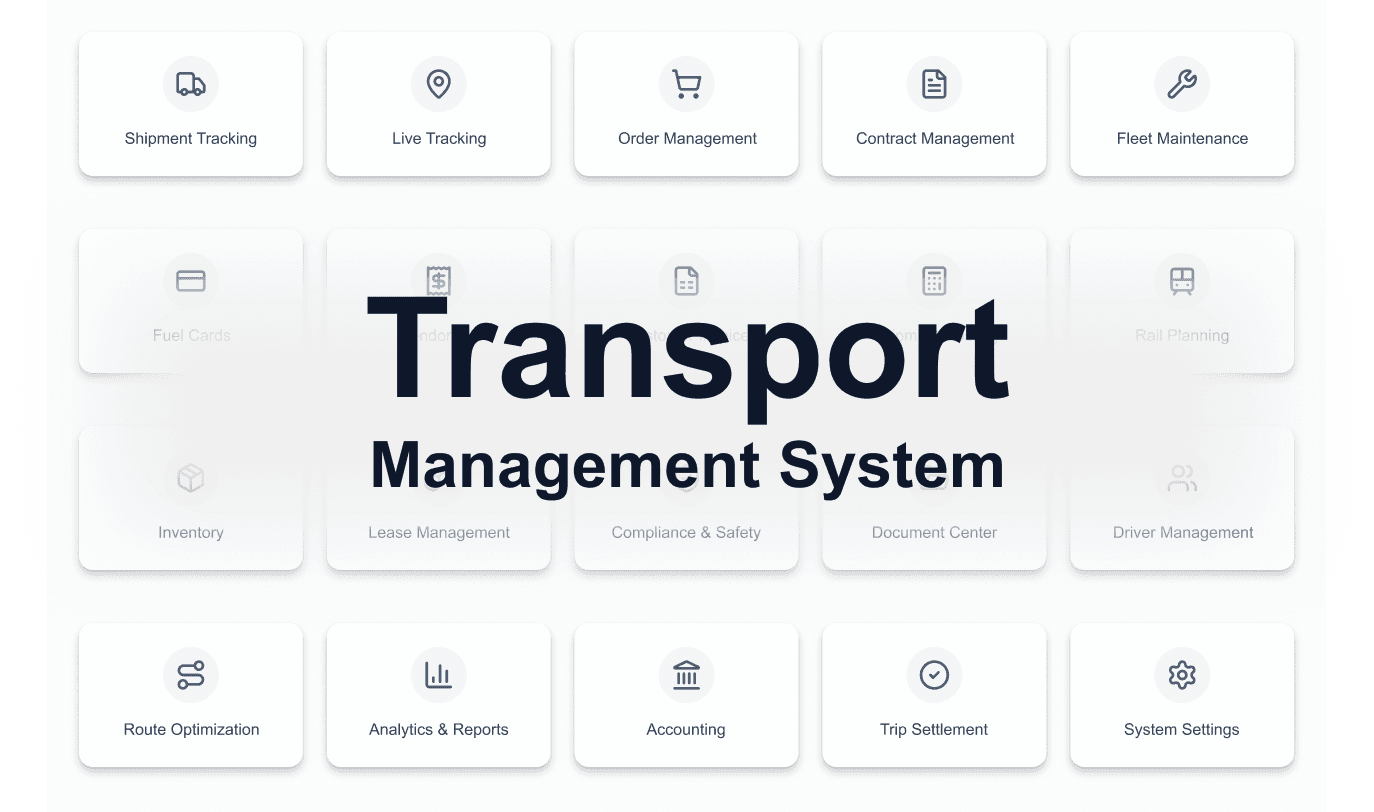
TMS Platform Modernization - Redesigning and Adding new Features in Enterprise Logistics Software for 50+ Clients

Plant Management System
Designing a real-time system to track, categorize, and visualize vehicle movement within the plant, optimizing space utilization and resource allocation.

ECG App
An ECG interpretation app built for practitioners and cardiovascular professionals. Designed to support accurate, efficient, and expert-level diagnosis in daily clinical practice.

Womeyn
A platform by women, for women. Womeyn supports women-led businesses through a socially-driven eCommerce ecosystem. Empowering women through community, commerce, and economic independence.

Design system project
A scalable and unified design system built to streamline our TMS platform, ensuring consistency, efficiency, and a seamless user experience across all logistics operations.